
Using QuIP and Causal Map in an Evaluation, a WFP interview with DeftEdge
Alexandra Priebe from the World Food Programme, interviewing Ashley Hollister and Sarang Mangi from the DeftEdge on their experience on using QuIP and Causal Map in their evaluation.
Alexandra Priebe (WFP), interviewing Ashley Hollister and Sarang Mangi (DeftEdge)
Earlier this year, the World Food Programme finalized the “Thematic Evaluation of WFP’s Contribution to Market Development and Food Systems in Bangladesh and South Sudan from 2018 to 2022”, which used the Qualitative Impact Assessment Protocol (QuIP) for primary data collection. I sat down with members of the evaluation team, Ashley Hollister and Sarang Mangi, from DeftEdge Corp., to talk about their experience with using Causal Map.
You recently completed an evaluation for WFP using the Qualitative Impact Assessment Protocol (QuIP) to address impact and contribution questions regarding direct recipients and end beneficiaries of the intervention. Could you talk about your experience using Causal Map to analyse the data?
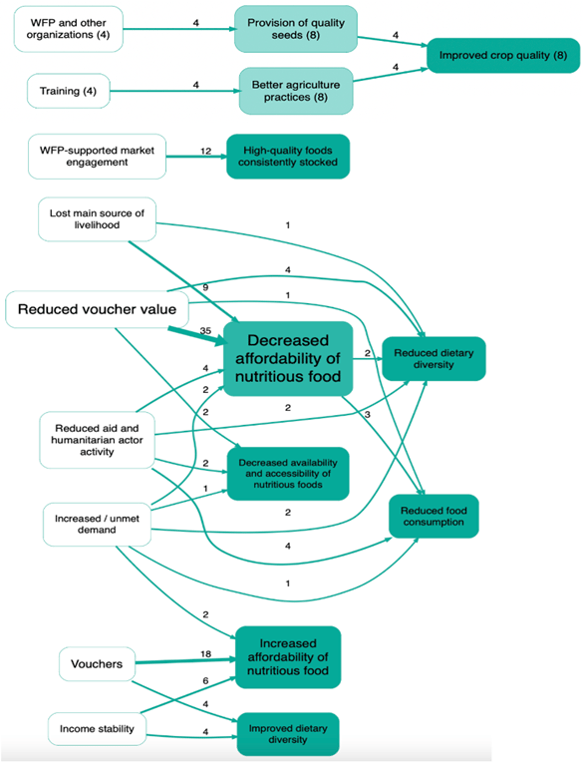
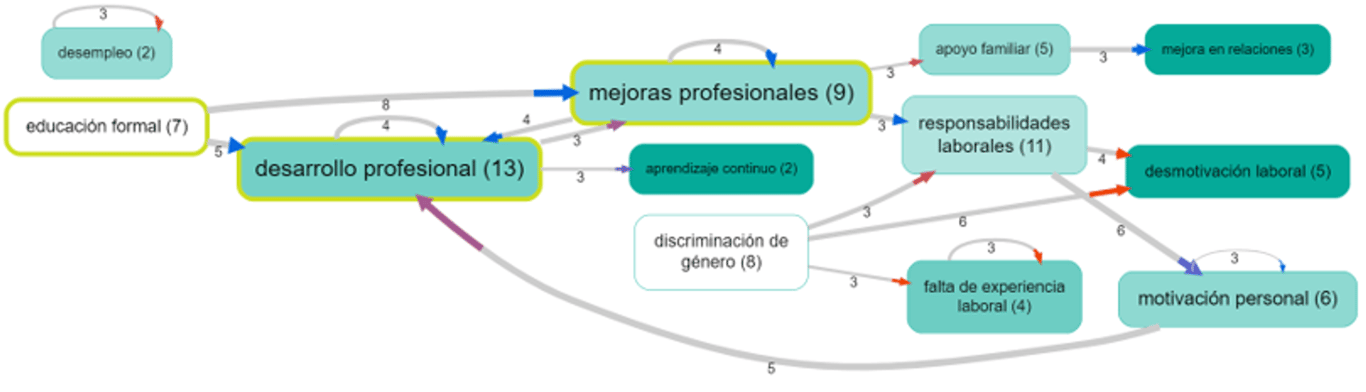
Overall, I would say using the Causal Map app to analyse the QuIP data was a positive experience. The software itself was quite intuitive and helpful in providing us with an option to visualize the causal linkages in the pathways that emerged from the qualitative data collected from different types of respondents. It was particularly useful in allowing us to visualise how different factors influence each other. The strength of the links in the map is represented by the thickness of the lines, which increases depending on how many people indicated the same cause and effect relationship. The app also has the option to display the total counts as a label, which was quite helpful.
Causal map visualising cause-effect links on assortment, availability and price dimensions
Is this an intuitive program or is there a learning curve that researchers need to plan for?
It does have a learning curve. The application becomes more efficient and easier to use if you have the notes and database set up in a format that’s compatible with uploading. We were just discussing the preparation needed to effectively use [Causal Map], and it is really useful to consider this as far back as the planning stage of the evaluation and understanding, ‘OK, how is this application going to be used, how does it function?’ even when you're developing the QUIP protocols and the analysis plan. ‘Which questions do you want to ask? How are you going to code responses? Is it going to be at the individual level or at the focus group level? How are you going to record notes?’ All of that should be decided in the beginning because all of that has to be done with the mindset of how this will go into this application. Otherwise, it is difficult to fix it if that's not all adequately prepared in advance. For example, say you have coded responses as either ‘crisis’ or ‘humanitarian’ and then you realize ‘Oh, those actually have the same meaning’, going back and grouping them together is quite complicated in the application (given the coding is conducted ‘live’ in the application through a more inductive approach). We found it challenging and time-consuming to go back to fix once the data is coded in Causal Map if that's not all adequately prepared in advance.
Could you talk a little about the coding process? What challenges did you encounter along the way?
We did face some issues with the Causal Map app itself, but to resolve them, we reached out to the support team who were very much helpful and responsive. There is a WhatsApp group, which is actually quite useful. You can see the types of questions other people are asking and they (Causal Map) resolve them quite quickly, getting back to you within an hour or two. This support function really helps, especially because it's a relatively new application.
(There are two main approaches to coding in Causal Map). You can either open the application and import your data using an Excel or Word file, then go through your notes and create the codes within the application itself. We initially piloted having all of the data in the (Causal Map) app first and tried coding in situ - looking at the text and coding the cause-and-effect links - and it does store that code where it was entered. However, in any results chain, you sometimes have a situation where an effect is also a cause, or you need to use the same terminology in both cause and effect to draw multiple links. We found it difficult to go back and search for what had been previously coded under "effect" if we then wanted to use it under "cause", as the app doesn't store it in that category.
In the end, we prepared the data in Excel and uploaded it into Causal Map because that allowed us to quality control and make those large changes more efficiently.
What were the strengths or advantages of using QuIP for this evaluation? How did the Causal Map add value to the analysis?
There are benefits and limits to QUIP as a method. Certainly, I think a benefit is getting a more nuanced perspective on the causal factors of changes experienced and how participants perceive what caused them. The double-blind aspect is the most unique but also the most complex aspect of QUIP in terms of maintaining it in its truest form. I think the assumption is being blind [to the evaluation purpose and subject], there would be less bias, but this can be challenging to implement in a humanitarian context. We observed this challenge in this evaluation, specifically.
Causal Map also provides a structured way to integrate and visualize all the findings collected through QUIP. It allows you to see all the linkages or set parameters for, say, the top 15 strongest linkages. The app offers features like filtering data based on specific criteria, merging similar. So, this gives you a level of control to go through the list and determine what makes the most sense [visually to present].
However, it's important to note that from a methodological perspective, the causal maps generated in Causal Map are not as scientifically robust as maps that might be created using more quantitative techniques, such as structural equation modelling (SEM). With SEM, you can statistically test the strength and significance of the causal relationships and control for confounding variables. The causal maps in Causal Map are based more on the subjective perceptions and experiences of the respondents, as interpreted by the researcher. While they can provide valuable insights, they don't have that same level of statistical rigor and objectivity.
What advice would you give other evaluators considering QuIP and Causal Map?
First, be very clear on the intention of using QuIP and Causal Map and integrate this clearly into the evaluation matrix and data analysis plan. This ensures everyone is on the same page in terms of the note-taking process and coding. Additionally, make sure that the team has the necessary capacity, and check this in the evaluation timeframe. I have experienced this in a different evaluation, where on paper the approach looked beneficial (for responding to the evaluation questions), but there wasn't sufficient capacity in the team to carry it out. The evaluation was too complex in terms of the context that it was operating in, and all this data was collected, but nothing substantial is really coming out from it. (In this example QuIP was used, however the Causal Map app was not).
Another lesson that we learned, at least from my perspective, is that having fewer, broader questions and interviewing more people (than would be minimally required by the QuIP methodology) would probably be more advantageous. This approach allows more time to dig into what changes are happening and why, while also simultaneously gathering enough information to have links drawn in the Causal Map. While you don't need to interview as many people, I would see that it would be more valuable to have a larger sample with a narrower set of questions to get better information and stronger causal links. These would be my main points of advice, adding on to what we've already shared.
Note from the CM team
Alexandra is talking about her experience with QuIP tomorrow (27/09/2024) at the EES Conference:
“Empirically Informed Upgrading of Organisational Theories of Change: Uptake of QuIP as an Example of Evaluative Bricolage.”
If you’re in Rimini, don’t miss the opportunity!
Related Posts


Our seamless stories workflow in practice
An evaluation project about gender gaps faced by women pursuing STEM careers at DuocUC.